Image source: Getty Images
Passive investing has become the vehicle of choice for most investors today. It’s easy to see why. At the depths of the global financial crisis in early 2009, the S&P 500 sat at 750 points. Since then, the index has gone on the biggest bull market in its history and now trades at over 6,000. A rise of over 700% means that a £10,000 investment made then would be worth £70,000 today.
Efficient market hypothesis
Passive investing can trace its roots back to the 1960s in an academic theory known as the efficient market hypothesis. The idea behind this theory is that are so many smart, active managers doing fundamental and valuation analysis that stocks always trade at their fair market value. This fact makes it difficult for active managers to consistently beat the market.
Initially confined to large pension funds, passive investing strategies began to go mainstream in the late 1990s. Today, index funds, and the more recent innovation of exchange-traded funds (ETFs), are marketed as a low-cost, diversified approach to investing.
S&P 500 bubble
Passive investing is a great strategy when a stock market is rising. But the inexorable rise of the US stock market over the past 15 years is, I believe, breeding complacency.
One area that has concerned me for some time is stock market concentration. If I invest in an S&P 500 tracker, I am supposedly buying into a broad basket of stocks across different sectors. But that isn’t the case anymore given that the top 10 holdings are predominantly in the technology space and account for 34% of the entire weighting.
Just because a passive investing strategy has worked so well in the past, doesn’t mean it will continue to do so. And one complete unknown today is that these types of investment vehicles have never been tested in a true bear market. After all, the 2020 decline lasted just a handful of weeks and the decline in 2022 lasted only 9 months.
I am still picking stocks
A small percentage of my Stocks and Shares ISA portfolio is allocated to an S&P 500 tracker. But for me now is not the time to be asleep, which is why I predominantly pick my own stocks.
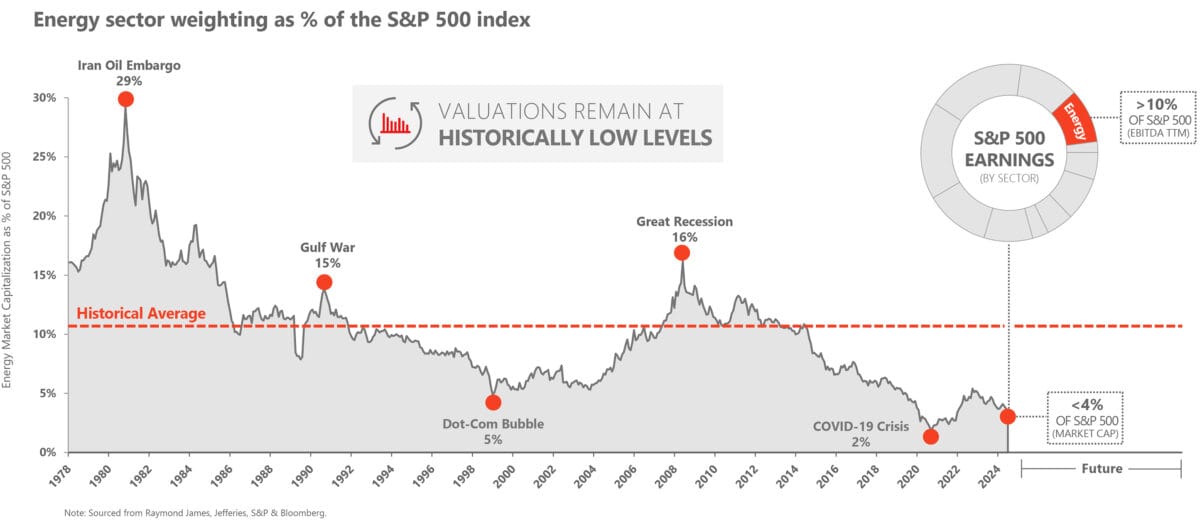
One sector that I remain bullish on in the long term is energy. The following chart from Devon Energy, highlights how distorted the market has become. The combined weighting of the top three stocks, Apple, Nvidia, and Microsoft is five times the entire energy market. That to me screams opportunity.

Source: Devon Energy
I am of the view that we are entering a phase where demand for energy is going to soar. Onshoring of manufacturing capability in the US continues at pace. The acceleration of the green revolution will, ironically, drive a surge in demand for energy, as the result of highly energy-intensive mining operations for metals.
But the biggest driver for energy will come from the tech companies themselves. Data centre growth to manage generative AI capabilities will see an explosion in energy demand like we have never witnessed before.
I particularly like BP and Shell because of their ultra-cheap valuations compared to their US peers. Neither is priced to reflect what I see as an oncoming tsunami in demand over the next decade and more.


